Key takeaways

  • A Special Purpose Acquisition Company (SPAC) is a publicly traded corporation that has under two years to merge with another company.

  • SPACs are private companies attempting to be made public through acquisition or mergers and are formed to raise funds to buy another company.

  • In the initial public offering (IPO), units are typically priced at $10 per share for SPAC investment.

A Special Purpose Acquisition Company (SPAC) is not a new investment concept, although the SPAC market has moved closer to the investment mainstream in recent years. If you’re new to SPACs, this overview can help you understand how to invest in SPACs and why SPAC investments may offer an opportunity to add diversification to your portfolio.

“Investors need to pay attention to shifting sands in the SPAC market given regulatory changes. Hopefully, investors will move away from viewing SPACs as an investment category and instead evaluate the underlying companies’ individual prospects.”

Eric Freedman, chief investment officer at U.S. Bank

What is a SPAC?

A SPAC is a shell company promoted by an investor or management team to take it from private to public. Third-party investors raise capital through an initial public offering (IPO). After raising funds, SPAC managers seek to put those assets to work by acquiring one or more companies not yet listed on a public stock exchange, eventually trading under their own stock symbol.


What is a shell company?

Simply put, a shell company serves as a transactional vehicle for raising funds via an IPO and doesn’t offer services or products. A shell company can be used for many purposes, including to buy real estate, move funds between bank accounts, and collect royalties.


What is a SPAC stock?

A SPAC is a unique investment vehicle that raises capital through an IPO with the special purpose of acquiring another company. By law, companies targeted for acquisition are identified once the SPAC has completed its IPO and is fully funded. Therefore, SPACs have earned the moniker of “blank check” companies, as investors don’t know which company or companies a SPAC will ultimately acquire with the funds it raises through the IPO.


How do SPACs work?

Once created, a SPAC will begin raising funds through an IPO. After the money is raised, that capital is held in a trust until the SPAC determines which private company it wants to acquire and make public. Once acquired, the SPAC’s investors will then decide if they wish to hold onto their shares, buy more shares at below-market value or cash out their shares.

Alternatively, if a SPAC doesn’t fulfill its mission to complete a merger within the time constraints, it will liquidate all funds raised and return them to investors.


How to buy SPAC stock?

As a public investor, SPACs allow you to partner with venture capital firms and investment professionals to get involved with a company early on. To buy SPAC stock, you’d take the same steps as you would for investing in current publicly traded companies – working directly with a financial advisor or visiting a retail brokerage website.


SPAC news: SPACs rapid growth – and decline – in popularity

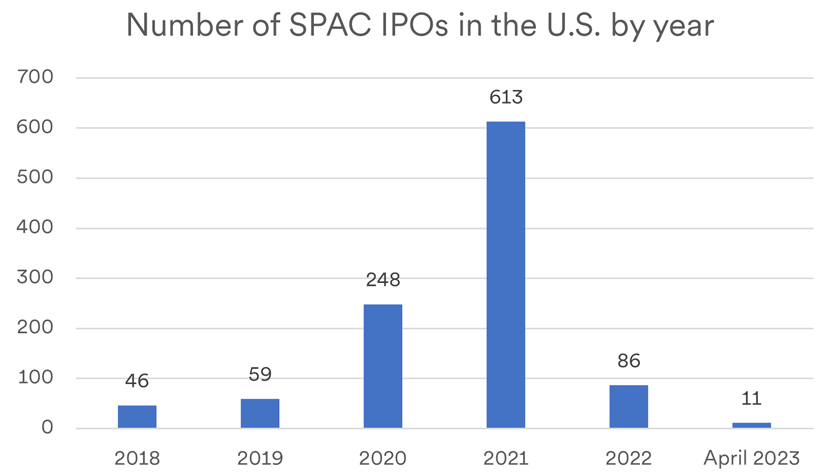
The surge in SPAC financing in 2020 and 2021 may have been an outgrowth of an exceedingly healthy global equity market. Investors became more interested in exploring different ways to put money to work, and SPACs appeared to offer an intriguing opportunity to get in on what many perceived as a “ground floor” opportunity with companies that have yet to go public.

“SPACs are not an asset class,” says Eric Freedman, chief investment officer at U.S. Bank. “SPACs are the byproduct of a corporate finance decision. Companies can raise capital in many ways, including through a traditional IPO, a direct listing or through a SPAC. We don’t look at a company’s growth prospects or its investment merits based on its capital raising methodology.”

There were 248 SPAC offerings in 2020 and 613 in 2021, but activity dropped dramatically, to 86 in 2022. Through April 2023, there were just 14 SPAC offerings.1

Source: S&P Statista as of April 18, 2023.

The drop-off in new SPAC issuances may be due partly to increased regulatory scrutiny of SPACs. The Securities and Exchange Commission (SEC) has focused on the following:

  • Warrants. Warrants are securities that give investors the right to purchase another unit of the SPAC at a certain price before a particular time. Most SPACs issuing these warrants treated them as assets on their balance sheet. In 2021, the SEC issued a determination saying that the SPAC must treat these warrants as liabilities in certain circumstances. Classifying warrants as liabilities could result in more regulatory reporting requirements for SPACs, which could affect offering activity and SPAC investment.
  • Disclosures. March 2022, the SEC proposed additional rules and amendments to increase disclosure and improve investor protection in SPAC IPOs. Doing so would require, among other things, disclosures about SPAC sponsors, their potential conflicts of interest and how share value can be diluted through features that reward specific investors or entities associated with a SPAC. Also proposed are disclosures relating to the fairness of these transactions.2

“The biggest driver of increased SEC scrutiny is likely the desire to create more visibility for investors,” says Freedman. “It’s placing tighter controls on how these firms can project out revenue and earnings growth.”


Recent SPAC performance

Another factor in the changing environment for SPACs may be underwhelming results from recent offerings. “Retail investors may have pulled back from SPACs due to some relative performance concerns,” says Freedman. He notes that several high-profile SPAC offerings performed well for insiders and sponsors, but not as favorably for the investing public. “This has likely taken some of the luster off of SPACs for those who look at them as a category, at least for now,” he adds.

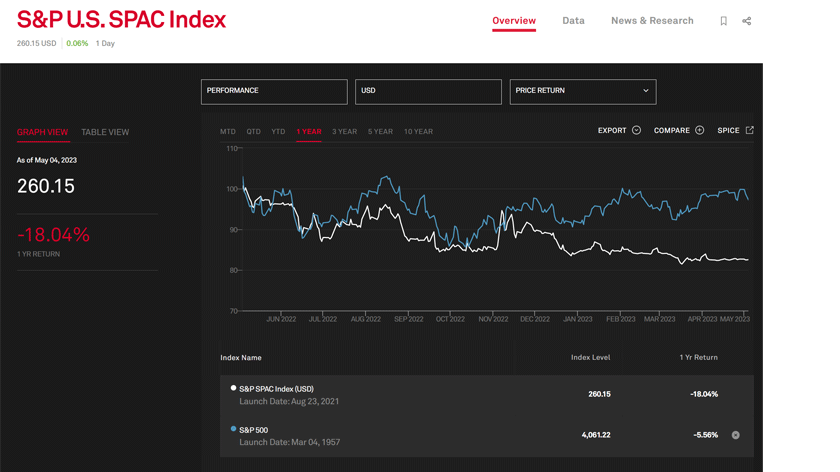
During a challenging investment environment across the broad capital market spectrum, SPAC results suffered as well. The recent decline in new SPAC index activity may reflect waning investor enthusiasm for this part of the market. However, this may also be a short-term development, and activity could potentially recover over time.

Source: S&P Global as of May 5, 2023. See related disclosures at end of article.

A change in the investment environment may also be a contributing factor. “Some of what you see with SPACs is similar to the market for more traditional forms of stock IPOs,” says Rob Haworth, senior investment strategy director at U.S. Bank. “Investors attracted to these types of investments are looking for a chance to generate capital appreciation regardless of economic conditions.” He explains that in a slower-growth environment, which was predominant in previous years, SPACs and IPOs drew investor interest because they could potentially grow at a rate that outpaced a slower-growing economy.

“That wasn’t so easily accomplished when the pace of economic growth picked up as it did in 2021,” says Haworth. He notes the sectors that benefited from cyclical economic growth were more advantageously positioned for the current environment. Growing investor concerns with the speculative nature of SPACs may have dampened enthusiasm, with increasing regulatory oversight potentially adding to investors’ caution.


How to invest in SPAC

Because SPAC investors lack advanced knowledge of potential targeted acquisitions before they commit money to it, it’s crucial to approach SPAC investing with your eyes open. Exercise caution as you consider this an appropriate diversification tool and assess each offering to determine whether it’s worth investment. Selectivity in choosing individual opportunities is critical regardless of the types of investments you’re considering. With SPACs, you’re primarily judging the track record and expertise of the management firm making the offering.

“Well-managed SPACs that are focused on industries in a strong position can represent attractive opportunities for investors,” says Freedman. “Yet investors need to pay attention to shifting sands in this marketplace given regulatory changes that may impact disclosure and accounting rules. That could alter the landscape for how people view SPACs. Hopefully, investors will move away from viewing SPACs as an investment category and instead evaluate the underlying companies’ individual prospects.”

Depending on a SPAC’s specific features, there are different risk levels associated with investing, including the inflation impact on investment. Before investing in SPAC, take some time to familiarize yourself with investing strategies to help you work toward your financial goals.

Learn about our approach to investment management.

This information represents the opinion of U.S. Bank Wealth Management. The views are subject to change at any time based on market or other conditions and are current as of the date indicated on the materials. The factual information provided has been obtained from sources believed to be reliable, but is not guaranteed as to accuracy or completeness. U.S. Bank is not affiliated or associated with any organizations mentioned.

SPAC managers may be unqualified or incompetent, a risk made more pronounced by lack of any operating history or past performance of the SPAC. There is a risk that an acquisition may not occur, and the investment may decline in value even if the acquisition is completed. Diversification and asset allocation do not guarantee returns or protect against losses.

The following disclosures in italics relate to the S&P Global chart noted above and are cited here verbatim from the S&P Global website:

Indexes shown are unmanaged and are not available for direct investment. The S&P 500 Index consists of 500 widely traded stocks that are considered to represent the performance of the U.S. stock market in general. The S&P U.S. SPAC Index is designed to measure the performance of a minimum of 30 common stocks of special purpose acquisition companies (SPACs) listed on U.S. exchanges. S&P Dow Jones Indices defines various dates to assist our clients in providing transparency. The First Value Date is the first day for which there is a calculated value (either live or back-tested) for a given index. The Base Date is the date at which the index is set to a fixed value for calculation purposes. The Launch Date designates the date when the values of an index are first considered live: index values provided for any date or time period prior to the index’s Launch Date are considered back-tested. S&P Dow Jones Indices defines the Launch Date as the date by which the values of an index are known to have been released to the public, for example via the company’s public website or its data feed to external parties. For Dow Jones-branded indices introduced prior to May 31, 2013, the Launch Date (which prior to May 31, 2013, was termed “Date of introduction”) is set at a date upon which no further changes were permitted to be made to the index methodology, but that may have been prior to the Index’s public release date.

All information presented prior to an index’s Launch Date is hypothetical (back-tested), not actual performance. The back-test calculations are based on the same methodology that was in effect on the index Launch Date. However, when creating back-tested history for periods of market anomalies or other periods that do not reflect the general current market environment, index methodology rules may be relaxed to capture a large enough universe of securities to simulate the target market the index is designed to measure or strategy the index is designed to capture. For example, market capitalization and liquidity thresholds may be reduced. Complete index methodology details are available at www.spglobal.com/spdji/en. Past performance of the Index is not an indication of future results. Back-tested performance reflects application of an index methodology and selection of index constituents with the benefit of hindsight and knowledge of factors that may have positively affected its performance, cannot account for all financial risk that may affect results and may be considered to reflect survivor/look ahead bias. Actual returns may differ significantly from, and be lower than, back-tested returns. Past performance is not an indication or guarantee of future results. Please refer to the methodology for the Index for more details about the index, including the manner in which it is rebalanced, the timing of such rebalancing, criteria for additions and deletions, as well as all index calculations. Back-tested performance is for use with institutions only; not for use with retail investors.

Typically, when S&P DJI creates back-tested index data, S&P DJI uses actual historical constituent-level data (e.g., historical price, market capitalization, and corporate action data) in its calculations. As ESG investing is still in early stages of development, certain datapoints used to calculate S&P DJI’s ESG indices may not be available for the entire desired period of back-tested history. The same data availability issue could be true for other indices as well. In cases when actual data is not available for all relevant historical periods, S&P DJI may employ a process of using “Backward Data Assumption” (or pulling back) of ESG data for the calculation of back-tested historical performance. “Backward Data Assumption” is a process that applies the earliest actual live data point available for an index constituent company to all prior historical instances in the index performance. For example, Backward Data Assumption inherently assumes that companies currently not involved in a specific business activity (also known as “product involvement”) were never involved historically and similarly also assumes that companies currently involved in a specific business activity were involved historically too. The Backward Data Assumption allows the hypothetical back-test to be extended over more historical years than would be feasible using only actual data. For more information on “Backward Data Assumption” please refer to the FAQ. The methodology and factsheets of any index that employs backward assumption in the back-tested history will explicitly state so. The methodology will include an Appendix with a table setting forth the specific data points and relevant time period for which backward projected data was used.

Index returns shown do not represent the results of actual trading of investable assets/securities. S&P Dow Jones Indices maintains the index and calculates the index levels and performance shown or discussed but does not manage actual assets. Index returns do not reflect payment of any sales charges or fees an investor may pay to purchase the securities underlying the Index or investment funds that are intended to track the performance of the Index. The imposition of these fees and charges would cause actual and back-tested performance of the securities/fund to be lower than the Index performance shown. As a simple example, if an index returned 10% on a US $100,000 investment for a 12-month period (or US $10,000) and an actual asset-based fee of 1.5% was imposed at the end of the period on the investment plus accrued interest (or US $1,650), the net return would be 8.35% (or US $8,350) for the year. Over a three-year period, an annual 1.5% fee taken at year end with an assumed 10% return per year would result in a cumulative gross return of 33.10%, a total fee of US $5,375, and a cumulative net return of 27.2% (or US $27,200).


Related articles

Is investing in an initial public offering a good idea?

It’s easy to get caught up in the excitement surrounding IPOs. Review these common misconceptions before investing.

Weekly market analysis

As of Friday’s close, the S&P 500 is up 25.7% for the year, with 11 of 11 sectors in positive territory, six of which are up 20% or more.

Disclosures

Start of disclosure content

Investment products and services are:
Not a deposit • Not FDIC insured • May lose value • Not bank guaranteed • Not insured by any federal government agency

U.S. Wealth Management – U.S. Bank is a marketing logo for U.S. Bank.

Start of disclosure content

U.S. Bank and its representatives do not provide tax or legal advice. Your tax and financial situation is unique. You should consult your tax and/or legal advisor for advice and information concerning your particular situation.

Equal Housing Lender. Deposit products are offered by U.S. Bank National Association. Member FDIC. Mortgage, Home Equity and Credit products are offered by U.S. Bank National Association. Loan approval is subject to credit approval and program guidelines. Not all loan programs are available in all states for all loan amounts. Interest rates and program terms are subject to change without notice.

Start of disclosure content

Based on our strategic approach to creating diversified portfolios, guidelines are in place concerning the construction of portfolios and how investments should be allocated to specific asset classes based on client goals, objectives and tolerance for risk. Not all recommended asset classes will be suitable for every portfolio.

Diversification and asset allocation do not guarantee returns or protect against losses.

Past performance is no guarantee of future results. All performance data, while obtained from sources deemed to be reliable, are not guaranteed for accuracy.

Equity securities are subject to stock market fluctuations that occur in response to economic and business developments.

International investing involves special risks, including foreign taxation, currency risks, risks associated with possible differences in financial standards and other risks associated with future political and economic developments. 

Investing in emerging markets may involve greater risks than investing in more developed countries. In addition, concentration of investments in a single region may result in greater volatility.

Investments in fixed income securities are subject to various risks, including changes in interest rates, credit quality, market valuations, liquidity, prepayments, early redemption, corporate events, tax ramifications and other factors. Investment in fixed income securities typically decrease in value when interest rates rise. This risk is usually greater for longer-term securities. Investments in lower-rated and non-rated securities present a greater risk of loss to principal and interest than higher-rated securities.

Investments in high yield bonds offer the potential for high current income and attractive total return, but involve certain risks. Changes in economic conditions or other circumstances may adversely affect a bond issuer’s ability to make principal and interest payments.

The municipal bond market is volatile and can be significantly affected by adverse tax, legislative or political changes and the financial condition of the issues of municipal securities. Interest rate increases can cause the price of a bond to decrease. Income on municipal bonds is free from federal taxes, but may be subject to the federal alternative minimum tax (AMT), state and local taxes.

There are special risks associated with investments in real assets such as commodities and real estate securities. For commodities, risks may include market price fluctuations, regulatory changes, interest rate changes, credit risk, economic changes and the impact of adverse political or financial factors. Investments in real estate securities can be subject to fluctuations in the value of the underlying properties, the effect of economic conditions on real estate values, changes in interest rates and risks related to renting properties (such as rental defaults).